
Dashboard
[column class=”column_left”]
Cornell University at its Sesquicentennial is the strategic plan for 2010-2015. The Strategic Metrics dashboard supports the assessment of the plan’s major objectives. To view the Strategic Metrics dashboard, click on the thumbnail to the right.
More information about the overall approach to measurement as well as definitions of specific metrics in the dashboard is available below.
[/column]
[column class = “column_right”]
[/column]
General Approach and Assumptions
The strategic plan sets forth a general approach and set of assumptions to guide the assessment of progress over this period.
General Approach
- Focus on university-wide (aggregated) metrics and qualitative indicators but include, where appropriate, unit-level ones.
- Organize metrics and qualitative indicators around goals and priorities.
- Include both quantitative and qualitative indicators.
- Have multiple indicators for each goal, given the complexity of the assessment, but as few as possible to enhance focus.
- Make the metrics flexible and adaptable to be useful across a wide range of academic areas or units.
- Consider the need to minimize the amount of staff time or additional staff to implement the metrics.
- Insofar as possible, use existing sources of data and information.
Assumptions
- It is exceedingly difficult to develop fully adequate measures of progress toward greater excellence in a research university.
- No particular metrics or qualitative indicators will be sufficient, but some sets or combinations of them will be significantly better for tracking progress than others or than having none.
- Metrics and qualitative indicators need to be developed in consultation with those people in the areas being measured (faculty, students, and staff). The metrics developed in this plan, therefore, must be considered a draft for further consultation and development.
- Metrics help to promote progress and improvement by holding the institution or units accountable for working toward goals or objectives, but they also can do harm if action is focused on moving particular numbers or indicators rather than the larger purposes for which they are created.
- Any set of metrics will have unintended consequences that are important to analyze and anticipate.
- Any set of metrics or indicators should be viewed as a whole and be part of an overall qualitative assessment and judgment.
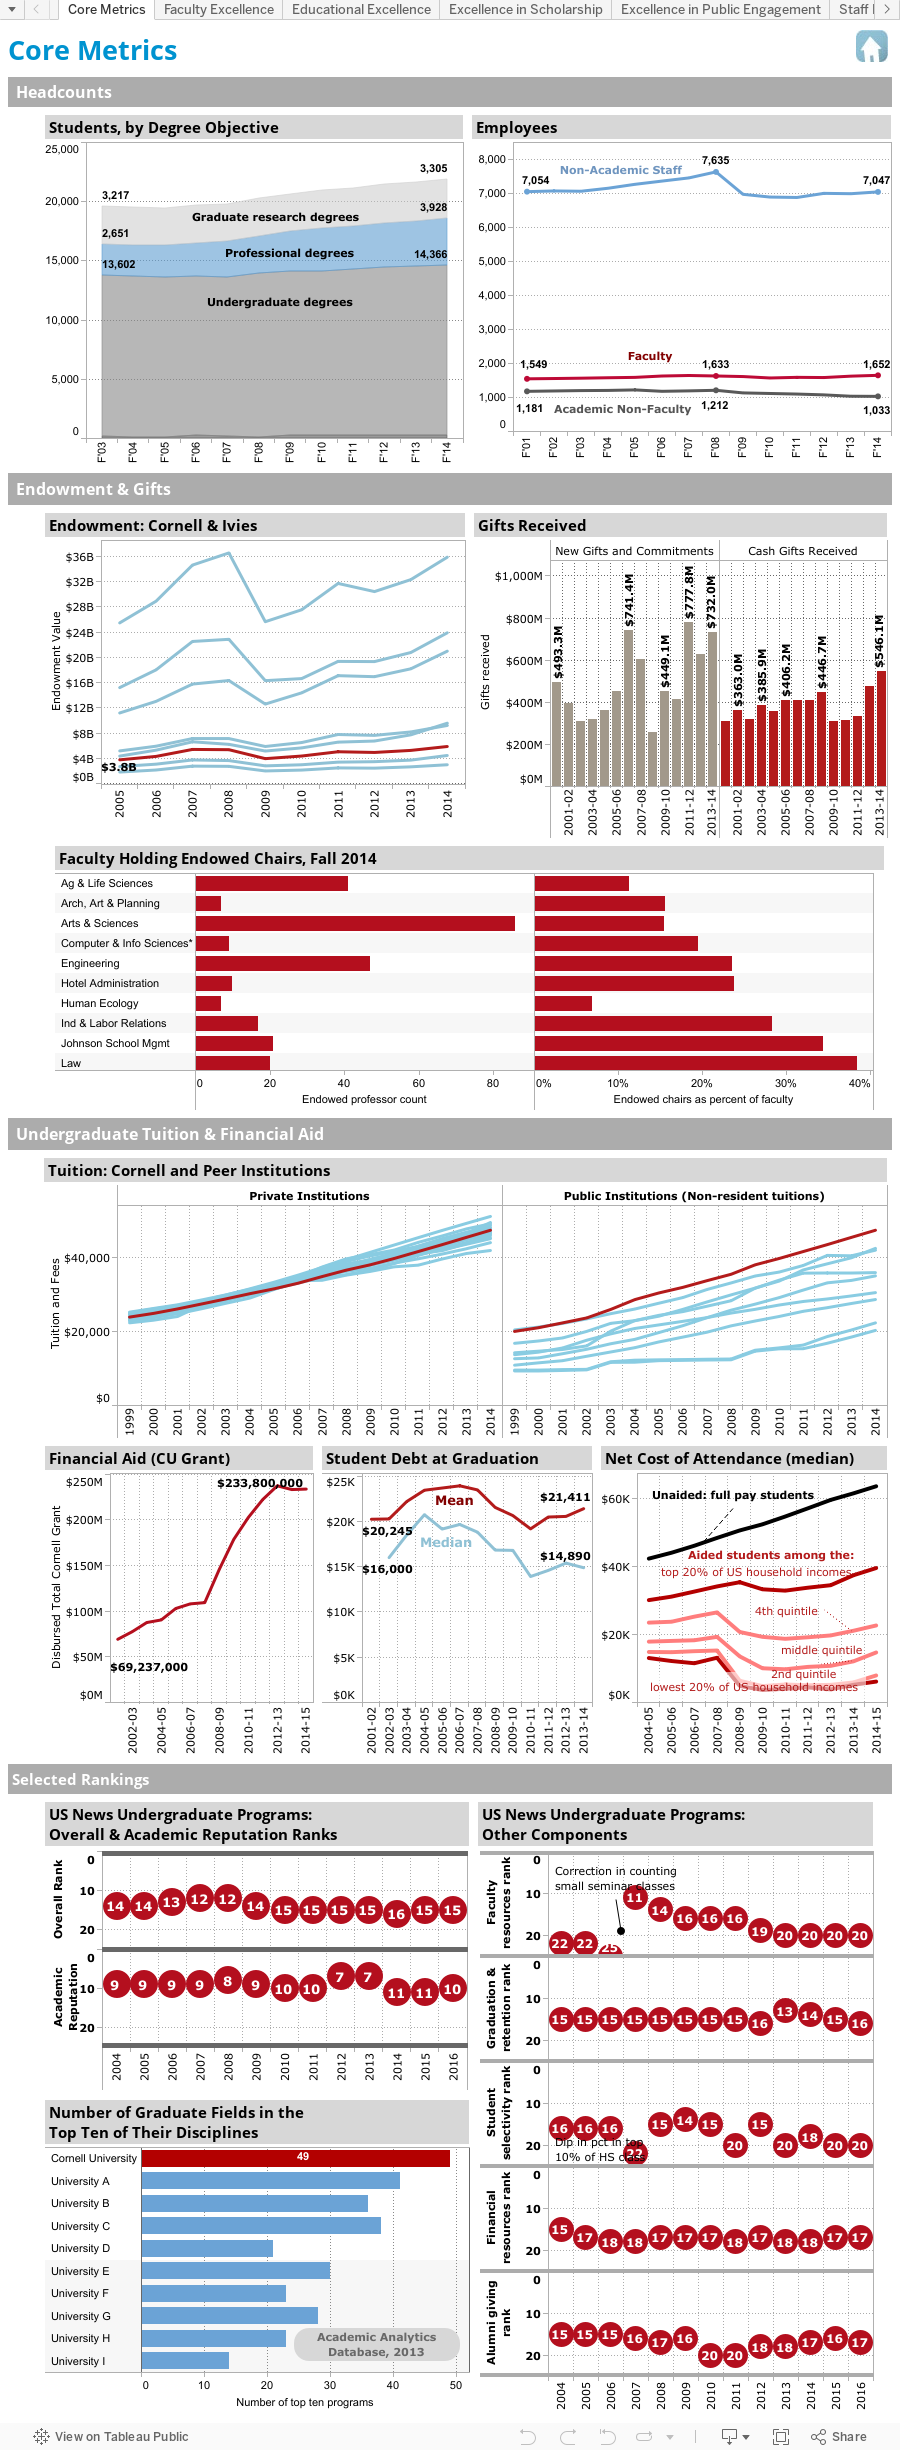
Core Metrics
Headcounts
- Students, by Degree Objective. Enrollment figures are routinely reported by Institutional Research & Planning. Here, enrollments are presented by degree objective, where research degrees are defined as the MA, MS, PhD, MFA, DMA and JSD. The professional degrees include the MBA, JD, DVM, MEng, MFS, MHA, MILR, MPS, MRP, MArch and MMH. Headcounts are as of the sixth week of the semester.
- Employees. Headcounts of active employees are reported in the University Factbook by Institutional Research & Planning. Academic employees include ranked professors, instructors, lecturers, teaching associates, research and extension associates, librarians, and archivists. We exclude student employees, temporary employees, casual employees, and those on layoff or leave status. Because postdocs are temporary employees, they are not included here. Headcounts are as of November 1 of each year.
Endowment & Gifts
- Endowment: Cornell & Ivies. These figures are made available by the National Association of College and University Business Officers (NACUBO).
- Gifts Received. Cash gifts are as reported to the Council for Aid to Education for the Voluntary Support of Education Survey. “New Gifts and Commitments” include outright gifts, the full value of multi-year pledges, deferred gifts, and in kind gifts. These figures are tracked by Alumni Affairs and Development.
- Faculty Holding Endowed Chairs. As tracked in the Academic Personnel Database, and reported by Institutional Research & Planning.
Undergraduate Tuition & Financial Aid
- Tuition: Cornell and Peer Institutions. These data are collected by Institutional Research & Planning.
- Financial Aid (CU Grant). Calculated by Institutional Research & Planning.
- Student Debt at Graduation. Cornell figures are calculated by Institutional Research & Planning and reported annually in the Common Data Set. Every four years, the National Center for Education Statistics asks institutions to participate in the National Postsecondary Student Aid Study (NPSAS) which in turn estimates the average student debt of college graduates nationwide.
- Net Cost of Attendance. Calculated by Institutional Research & Planning.
Selected Rankings
- US News Undergraduate Program rankings. The data underlying these figures come from the annual US News & World Report’s “Best Colleges” guide. The overall ranking takes into fifteen different measures grouped into the six sub-areas illustrated here: academic reputation (22.5% of overall ranking); faculty resources (20%), student retention (20%), student selectivity (15%), financial resources (10%), and alumni giving (5%). One additional measure, not illustrated here, is “graduation rate performance”; this is the difference between the actual six-year graduation rate at Cornell and the rate that USN&WR predicts Cornell should have based on our admissions profile. Cornell “over-performs” on this measure.
- Number of Fields in the Top Ten of Their Disciplines. The data represented here are derived from the Faculty Scholarly Productivity Index (FSPI) created by Academic Analytics, LLC. The FSPI is a weighted average of journal publications, books, citations, grants and honorary awards; weights vary by academic discipline. This graphic was created using the 2010 database released in spring 2012.
Faculty Excellence
- Faculty Over and Under Age 55. Faculty include assistant, associate and full professors. Faculty age is reported by Institutional Research & Planning in the University Factbook.
- Faculty Salary. These figures represent average salaries at various peer institutions as they are reported to the American Association of University Professors and published in Academe. Salaries are reported by rank; the data represented here weight these salary-by-rank averages to reflect the distribution by rank at Cornell. More analyses of faculty salaries are available from The Chronicle of Higher Education.
- New Tenure-Track Appointments. These numbers, tracked annually by Institutional Research & Planning, track new appointments to the tenure track.
Educational Excellence
- Learning Gains. The Senior Survey asks students in the spring of their senior year to estimate how much their experience at Cornell has contributed to their growth in a number of areas; a subset of areas is listed here. A total of 1,519 seniors participated in the 2012 Senior Survey, yielding a response rate of 47%. The Senior Survey is administered by Institutional Research & Planning; more information is available on their website.
- Undergraduate Applications, Cornell and Peers. Figures are as reported in the National Center for Education Statistics Integrated Postsecondary Education Data System (IPEDS).
- Six-Year Graduation Rate. Calculated by Institutional Research & Planning. For additional detail, see IRP’s website.
Excellence in Scholarship
- Number of Fields in the Top Ten of Their Disciplines. The data represented here are derived from the Faculty Scholarly Productivity Index (FSPI) created by Academic Analytics, LLC. The FSPI is a weighted average of 1) journal publications, 2) books, 3) citations, 4) grants and 5) honorary awards; weights vary by academic discipline. This graphic was created using the 2010 database released in spring 2012.
- Research Expenditures. Research expenditures are reported by the Office for the Vice Provost for Research.
Excellence in Public Engagement
- Cornell Center for Technology Enterprise and Commercialization (CCTEC). “Disclosures” are the first step in the technology transfer process; these short documents describe and disclose new technologies and works of authorship. “Patents” represent a set of rights of an inventor as protected by a sovereign state. To ensure eligibility for U.S. patent rights covering an invention, the patent application must be filed within one year of public disclosure. “Agreements”: When partners from industry are interested in licensing a patented invention, they sign Confidentiality Disclosure Agreements with CCTEC so that they can gather necessary details about the invention. “Patents” represent a set of rights of an inventor as protected by a sovereign state. “Licenses” are granted by Cornell to industry partners to commercialize the results of Cornell research to benefit the public. Licenses may be issued for technological inventions or for new varieties of plants produced by traditional breeding methods. CCTEC summarizes these figures in an annual report available on the web.
- Seniors’ Involvement in Community Service and Community Based Research. The Senior Survey asks students in the spring of their senior year to estimate how much their experience at Cornell has contributed to their growth in a number of areas; a subset of areas is listed here. A total of 1,519 seniors participated in the 2012 Senior Survey, yielding a response rate of 47%. The Senior Survey is administered by Institutional Research & Planning; more information is available on their website.
- Tenured and Tenure-Track Faculty Involvement in Public Engagement. One section of the 2010 Faculty Work Life Survey focused explicitly on public engagement. This section began by defining public engagement as “work with Cornell’s external communities, defined broadly from local to global, which involves the transfer and application of university-based research or scholarship to address issues or problems of interest to those communities.” Of the 1,514 tenured and tenure-track faculty invited to participate in this survey, a total of 989 participated for a 65% response rate. The Faculty Work Life Survey is administered by Institutional Research & Planning; more information is available on their website.
Staff Excellence
- Training through Organizational Development. These figures are tracked by the Office of Human Resources.
- Median Age, Age at Retirement of Staff and Faculty. These figures were calculated by Institutional Research & Planning.
- Succession Planning. These figures are tracked by the Office of Human Resources.
- Employer Awards. Awards are reported on an HR website.
Diversity
The Diversity Dashboard project was created as part of the work of the University Diversity Council and the Diversity Data Committee. The data were compiled by Institutional Research & Planning, and are drawn from fall semester “snapshots” of Cornell populations. Student numbers exclude: students not seeking degrees, students enrolled in absentia, and students who are in the Employee Degree Program. Ranked faculty include faculty titles (assistant, associate, and full professor) including those that are also part-time, clinical, and/or acting. “Other academic employees” include postdoctoral fellows, instructors, lecturers, teaching associates, research and extension associates, librarians, and archivists. “Staff” figures exclude all temporary, casual, and student titles.
More on the Diversity Dashboard is available on IRP’s website.